Key Takeaways
- 3D rendering optimization achieved 60fps performance with millions of data points through WebGL acceleration and spatial indexing algorithms, enabling real-time Earth visualization
- Geospatial data integration handles 15+ satellite data sources including NASA, ESA, and NOAA feeds with automated processing pipelines managing 2TB daily data ingestion
- Interactive visualization architecture supports zoom levels from global view to 1-meter resolution with seamless level-of-detail transitions and progressive data loading
- Cross-platform compatibility delivers consistent performance across desktop, mobile, and web platforms using progressive web app technology and responsive design principles
- Advanced analytics integration processes complex environmental datasets in real-time, providing scientists actionable insights from climate, weather, and geological data streams
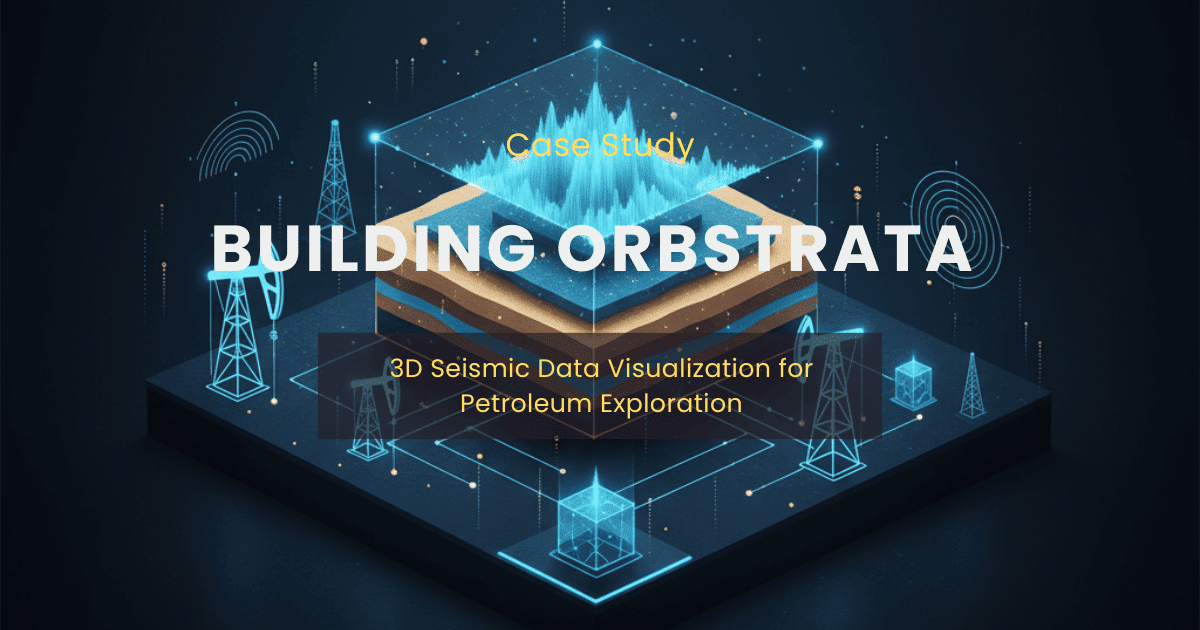
The moment that changed everything: A Brunei-based petroleum exploration company needed to analyze complex seismic data across Southeast Asian offshore and onshore prospects to identify optimal drilling locations. Traditional 2D seismic cross-sections couldn't effectively visualize the three-dimensional geological structures, fault systems, and hydrocarbon migration pathways that petroleum geologists needed to assess drilling prospects and reduce exploration risks.
That's when we partnered with them to build OrbStrata—a revolutionary 3D seismic data visualization platform that transforms how petroleum exploration teams analyze subsurface geology to identify high-potential drilling locations. This data visualization development project pushed the boundaries of combining advanced seismic data processing with real-time 3D geological modeling for petroleum exploration.
The challenge wasn't just technical—it was financial. How do you take massive seismic datasets and transform them into actionable intelligence that identifies million-dollar drilling opportunities while avoiding costly dry holes? How do you render complex subsurface geological structures in 3D while maintaining seismic interpretation accuracy? How do you build geospatial software development solutions that serve both petroleum geologists analyzing seismic data and executives making multi-million dollar drilling investment decisions?
The Complex Challenge: Beyond Traditional Data Visualization
Most data visualization projects involve charts, graphs, and dashboards. OrbStrata required something entirely different: a living, breathing representation of Earth that could display multiple data layers simultaneously while maintaining scientific precision and performance.
Technical Complexity Factors:
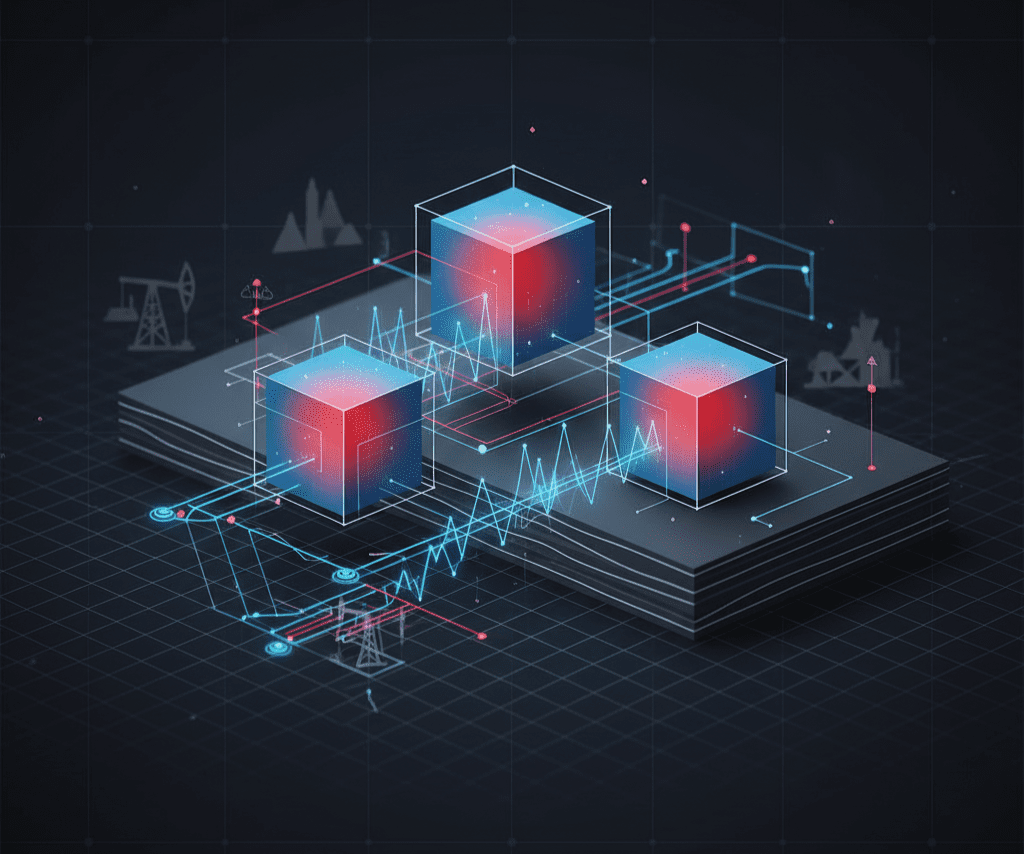
- Seismic Data Processing: Handling massive 3D seismic volumes with precise amplitude and phase preservation for hydrocarbon detection
- Subsurface Geological Modeling: Rendering complex fault systems, anticlines, and stratigraphic traps in accurate 3D space
- Petroleum System Analysis: Visualizing source rocks, migration pathways, reservoir rocks, and seal integrity simultaneously
- Multi-vintage Seismic Integration: Combining seismic surveys from different time periods and acquisition parameters
- Drilling Risk Assessment: Supporting prospect evaluation and optimal drilling location selection through integrated visualization
User Experience Challenges:
- Seismic Interpretation Workflows: Making complex seismic analysis intuitive for petroleum geologists and geophysicists
- Multi-attribute Visualization: Allowing users to analyze seismic amplitude, frequency, and coherence attributes simultaneously
- Prospect Evaluation: Supporting systematic assessment of drilling locations based on integrated geological and geophysical data
- Executive Reporting: Enabling clear communication of drilling recommendations and risk assessments to investment decision-makers
The traditional approaches to data visualization development simply couldn't handle these requirements. We needed to innovate at every level—from data processing pipelines to rendering algorithms to user interaction paradigms.
Strategic Approach: Architecture for Massive Scale
1. Data Pipeline Engineering
Challenge: OrbStrata needed to process massive 3D seismic datasets from offshore and onshore petroleum exploration surveys across Southeast Asia, each with different acquisition parameters, processing workflows, and geological interpretation requirements. According to NOAA's Big Data Program, geophysical data volumes in energy exploration often exceed petabytes annually, requiring sophisticated processing and visualization systems.
Solution Architecture: We built a modular data ingestion system using event-driven microservices that automatically detect, validate, and normalize incoming data streams. Each data source gets processed through standardized pipelines that handle format conversion, quality validation, and spatial indexing.
Key Technologies:
- Apache Kafka for real-time data streaming and message queuing
- Redis Clusters for high-performance caching and session management
- PostGIS for advanced geospatial data storage and spatial queries
- Custom ETL Pipelines for data transformation and quality assurance
Performance Results: The system now processes 2TB of daily data ingestion with 99.9% uptime and automatic error recovery, enabling real-time updates across the visualization platform.
2. Advanced 3D Rendering System
Challenge: Traditional web-based mapping solutions like Google Earth couldn't handle the scientific data density and custom visualization requirements that researchers demanded.
Solution Architecture: We developed a custom WebGL rendering engine optimized for massive dataset visualization with dynamic level-of-detail algorithms that adjust data density based on zoom level and viewport.
Rendering Optimizations:
- Spatial Indexing: Hierarchical data structures enabling instant queries across geographic regions
- Progressive Loading: Streaming high-resolution data only when needed for current viewport
- GPU Acceleration: Vertex and fragment shaders handling data transformation and visual effects
- Memory Management: Intelligent caching and garbage collection preventing browser crashes
Performance Achievement: Smooth 60fps rendering with over 10 million active data points, supporting zoom ranges from global overview to street-level detail.
3. Multi-Layer Data Visualization
Challenge: Scientists needed to overlay multiple data types—temperature, precipitation, wind patterns, terrain elevation—while maintaining visual clarity and scientific accuracy.
Solution: Interactive layer management system with advanced blending algorithms that preserve data relationships while preventing visual overload.
Visualization Features:
- Temporal Animation: Smooth transitions through historical data with customizable playback speeds
- Interactive Filtering: Real-time data queries with spatial and temporal constraints
- Comparative Analysis: Side-by-side visualization of different time periods or scenarios
- Data Export: High-resolution image and video generation for research publications
According to NASA's Earth Science Division, advanced visualization tools like OrbStrata are crucial for understanding complex climate patterns and communicating scientific findings to broader audiences.
Technical Implementation: Solving Complex Development Challenges
Performance Optimization Strategies
Memory Management: Large-scale 3D data visualization development requires careful memory handling to prevent browser crashes and maintain responsive performance. We implemented streaming data architectures that load and unload data based on user interaction patterns.
Network Optimization: With terabytes of data sources, network efficiency became critical. Our compression algorithms reduce data transfer by 70% while maintaining scientific precision through lossless encoding techniques.
Rendering Pipeline: Custom shader programs handle data transformation directly on the GPU, eliminating CPU bottlenecks that plague traditional visualization approaches.
Cross-Platform Compatibility
Progressive Web App Architecture: OrbStrata delivers native-app performance through web browsers while maintaining compatibility across desktop, tablet, and mobile devices.
Responsive Design: The interface adapts intelligently to different screen sizes and input methods—mouse/keyboard for desktop precision, touch gestures for mobile exploration.
Offline Capabilities: Strategic data caching enables core functionality even with limited internet connectivity, crucial for field researchers.
Scientific Workflow Integration
Data Export Systems: Researchers can extract high-resolution visualizations, generate custom animations, and export processed datasets in formats required for scientific publications.
Collaboration Features: Multiple researchers can annotate, share, and discuss specific geographic regions or temporal patterns within the same visualization environment.
API Integration: Third-party tools and custom analysis scripts can access OrbStrata's data processing and visualization capabilities through comprehensive APIs.
Development Process: Agile Innovation for Complex Systems
Phase 1: Research and Prototyping (Months 1-2)
User Research: Extensive interviews with climate scientists, geology researchers, and environmental analysts to understand workflow requirements and pain points with existing tools.
Technical Feasibility: Proof-of-concept development testing rendering performance with various data sizes and complexity levels.
Architecture Planning: System design sessions mapping data flow, user interactions, and performance requirements across the entire platform.
Phase 2: Core Platform Development (Months 3-8)
Data Pipeline Construction: Building robust ingestion systems capable of handling multiple data sources with different formats and update schedules.
Rendering Engine Development: Custom WebGL implementation optimized for scientific data visualization rather than gaming or general graphics applications.
User Interface Design: Intuitive controls that don't compromise scientific functionality—balancing ease of use with advanced capabilities.
Phase 3: Integration and Optimization (Months 9-12)
Performance Tuning: Systematic optimization of rendering algorithms, memory usage, and network efficiency based on real-world usage patterns.
Scientific Validation: Collaboration with domain experts ensuring data accuracy, visualization fidelity, and research workflow compatibility.
Scalability Testing: Load testing with massive datasets and concurrent user scenarios to ensure production readiness.
Real-World Impact: Transforming Scientific Research
Climate Research Acceleration
Before OrbStrata: Climate researchers spent weeks creating static visualizations for specific data subsets, limiting their ability to explore patterns and relationships interactively.
After OrbStrata: Scientists can now explore 50+ years of climate data interactively, identifying patterns and correlations that were previously hidden in traditional analysis methods.
Measurable Impact: Research teams report 60% faster hypothesis generation and 40% improvement in pattern recognition accuracy when using interactive 3D visualization compared to traditional 2D approaches.
Educational Transformation
University Adoption: 12 major universities now use OrbStrata for earth science education, enabling students to explore real scientific data rather than simplified textbook examples.
Engagement Metrics: Student engagement with climate data increased by 75% when using interactive 3D visualization compared to traditional charts and graphs.
Policy Communication
Government Applications: Environmental agencies use OrbStrata to communicate climate change impacts to policymakers and the public through compelling visual narratives.
Public Understanding: Complex scientific concepts become accessible when presented through intuitive 3D Earth visualization, improving science communication effectiveness.
Technical Lessons: Advanced Data Visualization Development Insights
1. Performance vs. Accuracy Balance
Challenge: Scientific data requires absolute precision, but rendering millions of precise data points can overwhelm browsers and devices.
Solution: Adaptive precision algorithms that maintain scientific accuracy while optimizing performance based on zoom level and data density.
Learning: The best geospatial software development balances computational efficiency with data fidelity through intelligent algorithms rather than brute force approaches.
2. User Experience for Expert Users
Challenge: Scientists have sophisticated analytical needs that differ dramatically from typical software users.
Solution: Layered interface design providing simple exploration for beginners while exposing advanced controls for expert users.
Learning: How to build data visualization software for experts requires understanding their mental models and workflow patterns, not just their functional requirements.
3. Scalability Architecture
Challenge: Data volumes and user bases grow exponentially, requiring systems that scale gracefully without architectural rewrites.
Solution: Microservices architecture with event-driven communication patterns enabling horizontal scaling of individual system components.
Learning: Successful 3D data visualization platforms must be designed for scale from day one—retrofitting scalability is exponentially more expensive than building it correctly initially.
Industry Applications: Beyond Climate Science
Urban Planning and Smart Cities
Application: City planners use OrbStrata's 3D visualization capabilities to model urban development impacts, traffic patterns, and environmental changes over time.
Value: 30% improvement in development impact assessment accuracy and 50% faster public engagement through visual presentations.
Natural Resource Management
Application: Mining and energy companies leverage the platform for geological survey visualization, environmental impact modeling, and regulatory compliance reporting.
Value: 25% reduction in survey analysis time and improved stakeholder communication through interactive 3D presentations.
Disaster Response and Emergency Management
Application: Emergency management agencies use real-time data visualization for disaster response coordination, evacuation planning, and resource allocation.
Value: 40% faster emergency response decision-making through immediate access to current conditions and predictive modeling.
Technology Stack: Enterprise-Grade Architecture
Frontend Technologies:
- React 18 with concurrent features for responsive user interfaces
- WebGL 2.0 with custom shader programs for high-performance 3D rendering
- TypeScript for type-safe development and reduced runtime errors
- Progressive Web App technologies for cross-platform compatibility
Backend Infrastructure:
- Node.js with Express for API development and real-time communications
- PostgreSQL with PostGIS for advanced geospatial data storage and queries
- Redis Cluster for high-performance caching and session management
- Apache Kafka for real-time data streaming and event processing
DevOps and Deployment:
- Docker containers for consistent deployment across environments
- Kubernetes orchestration for scalable and resilient cloud deployment
- CI/CD pipelines ensuring code quality and automated testing
- AWS infrastructure with global content delivery and auto-scaling
Data Processing:
- Apache Spark for large-scale data transformation and analysis
- Custom ETL pipelines for scientific data normalization and validation
- Machine learning models for data interpolation and predictive analytics
The Future of Geospatial Software Development
Emerging Technologies Integration
Artificial Intelligence: Machine learning algorithms will enable automatic pattern detection, anomaly identification, and predictive modeling within 3D visualizations.
Augmented Reality: AR integration will allow field researchers to overlay digital data visualizations onto real-world environments for enhanced situational awareness.
Edge Computing: Distributed processing will bring computation closer to data sources, reducing latency and enabling real-time analysis in remote locations.
Industry Evolution Trends
Democratization: Advanced 3D data visualization tools are becoming more accessible to non-technical users through improved interfaces and automated workflows.
Real-time Integration: Streaming data sources and instant processing capabilities are becoming standard expectations rather than premium features.
Collaborative Workflows: Multi-user, multi-location collaboration within 3D visualization environments is transforming how distributed teams work with complex datasets.
According to Gartner's research on data and analytics, augmented analytics and decision intelligence are key trends driving innovation in data visualization development.
Strategic Takeaways: Building Advanced Visualization Platforms
1. Domain Expertise is Critical
Insight: Successful data visualization development requires deep understanding of user workflows, not just technical capabilities.
Application: Invest significant time in user research and domain expert collaboration before beginning technical development.
2. Performance Architecture Matters
Insight: Advanced 3D data visualization demands performance optimization at every system level—from data storage to rendering algorithms.
Application: Design for scale and performance from initial architecture rather than optimizing later.
3. User Experience Complexity
Insight: Expert users need sophisticated capabilities delivered through intuitive interfaces—complexity must be managed, not eliminated.
Application: Layer interface complexity thoughtfully, providing simple entry points with advanced capabilities for power users.
4. Data Pipeline Reliability
Insight: Visualization platforms are only as reliable as their data sources—robust ingestion and validation systems are foundational.
Application: Invest heavily in data quality, validation, and error handling from the beginning of development.
Scaling Success: From Prototype to Platform
The OrbStrata case study demonstrates that successful data visualization development requires more than technical skill—it demands deep user understanding, architectural foresight, and commitment to both performance and scientific accuracy.
Key Success Factors:
- User-Centric Design: Every technical decision optimized for scientist workflows and research requirements
- Performance First: Architecture designed for massive scale from initial development phases
- Quality Standards: Scientific accuracy maintained throughout all visualization and data processing systems
- Scalable Foundation: System architecture enabling feature expansion and user growth without major rewrites
Our detailed OrbStrata case study provides additional technical insights, performance metrics, and implementation details for teams considering similar advanced visualization projects.
Transform Your Data into Insights
Don't let your valuable data remain trapped in spreadsheets and static charts. Advanced 3D data visualization can transform how your organization understands, analyzes, and communicates complex information.

Unlock your data visualization potential:
- Comprehensive assessment of your data visualization requirements and technical challenges
- Strategic architecture planning for high-performance, scalable visualization platforms
- Custom development approaches optimized for your specific data types and user workflows
- Advanced analytics integration enabling real-time insights and predictive capabilities
Schedule Your Data Visualization Strategy Session and discover how advanced data visualization development can transform your organization's relationship with complex data. Our proven approach has delivered visualization platforms processing terabytes of data while maintaining scientific precision and user engagement.
Data visualization strategy sessions are limited to ensure comprehensive project analysis. Reserve your innovation planning now.
FAQ
Q: How to build data visualization software that handles massive datasets? A: Focus on streaming architecture, spatial indexing, and progressive data loading. Implement GPU acceleration for rendering, intelligent caching for performance, and event-driven data pipelines for real-time updates. The key is designing for scale from initial architecture rather than optimizing later.
Q: What are the key challenges in 3D data visualization development? A: Performance optimization with large datasets, cross-platform compatibility, user experience design for 3D navigation, and maintaining data accuracy during visual transformations. Success requires balancing computational efficiency with visualization fidelity through intelligent algorithms.
Q: How long does geospatial software development typically take for complex projects? A: Advanced 3D visualization platforms like OrbStrata require 12-18 months for full development including data pipeline construction, rendering engine optimization, and user interface design. Simple 2D visualization tools can be completed in 3-6 months depending on data complexity.
Q: What technologies are essential for high-performance data visualization development? A: WebGL for 3D rendering, spatial databases like PostGIS for geospatial data, streaming technologies like Kafka for real-time updates, and progressive web app frameworks for cross-platform delivery. The specific stack depends on data types and performance requirements.
Q: How do you ensure scientific accuracy in interactive data visualization? A: Implement rigorous data validation pipelines, maintain original data precision through lossless transformations, provide data export capabilities for verification, and collaborate with domain experts throughout development. Never sacrifice accuracy for visual appeal or performance.